| Calculated Column Examples |  |
This article demonstrates the use of flag rules through the use of several examples. The screenshots in this article show the Flag Rule Properties window and the Flag With Rules window.
Tip: Windographer allows you to create calculated columns only if you have the Professional or higher edition of Windographer. Please visit www.windographer.com for information on the pricing and capability of each edition.
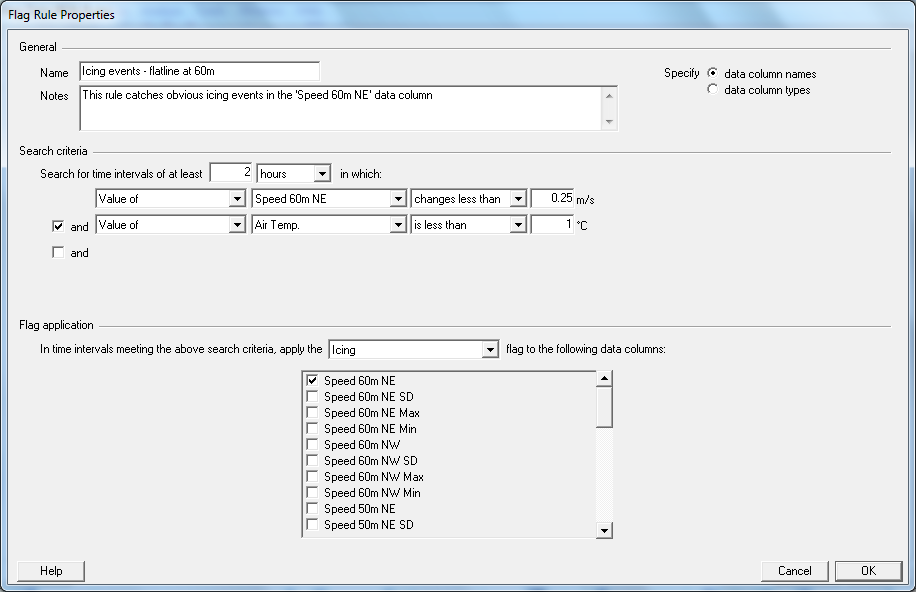
You can use a flag rule to find and flag icing events. For example, imagine you want to search for and flag all data segments in which a wind speed sensor 'flatlines', meaning its output stays the same for a long time, while the temperature is in the freezing range. The flag rule in the screenshot below does just that. It tells Windographer to search for data segments in which the wind speed sensor named 'Speed 60m NE' reports values that change less than 0.25 m/s over a two-hour period, at the same time as the data column named 'Air Temp.' reports a value below 1°C.

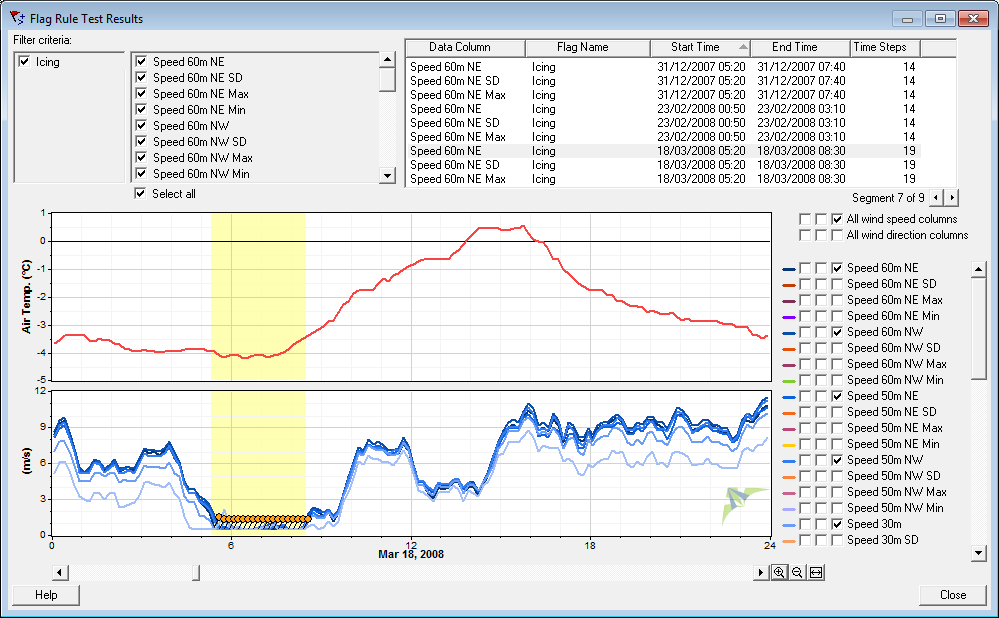
Using the Test Flag Rules feature, you can examine the segments flagged by this rule. It does indeed look like an icing event, since all the wind sensors, not just the 'Speed 60m NE' sensor, flatlined for a time, then when the temperature rose they started reporting normal-looking data again:

Tip: Any number of flag rules can apply the same flag. If you executed all the flag rules described above, Windographer would apply the 'Icing' flag to data segments that contain a flatline in a wind speed sensor, or a flatline in a wind direction sensor, or a negative wind shear event.
See also
Quality Data Column definition